
Doing your own Due diligence on Equity investment opportunities
Financial Due diligence is the main stage during project onboarding process on CrowdedHero platform. It shows existing situation of project owners financials and reveals future perspectives.
Financial statements are often viewed as the company’s backbone. Balance sheet represents the current capital structure, potential risks, and, along with the income statement the business health and sustainability of the company.
Debt-equity structure
First, it is important to understand the proportion of the company’s assets that are financed by equity and debt. To evaluate this relationship, financial analysts often use the debt-to-equity ratio.
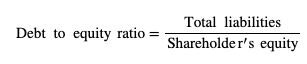
For example, a hypothetical growth-stage company ABC Inc. has 2M in total liabilities and 1.5M in total shareholder equity, which results in a D/E ratio of 1.33. What does it tell you?
Generally, the D/E ratio of more than 2 is considered a very risky sign for a company in any business stage. While the ratio of more than 1 is often viewed as a red flag for startups and growth stage companies, it can be stretched to 1.5 for mature and declining businesses. The rationale behind this is that the larger the D/E ratio, the greater the principal and interest payments to cover and, therefore, increased risk of solvency. On the other hand, for mature companies, it is common to use a greater portion of debt in the capital structure to finance R&D costs. In some cases, the D/E ratio can be below zero, which means that the company’s equity is negative and, thereof, total liabilities exceed total assets. This also implies a red flag, as the company currently might be at risk of bankruptcy.
Liquidity position
Second, it is desirable to look at the company’s ability to repay its debt obligations. Although there are many measures used in practice, the most extensively used are current and cash ratios.
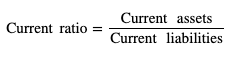
Current ratio indicates how many times can a company pay off its short-term obligations with current assets. Returning to the previous example of ABC Inc., let’s assume the company has 1M in current assets (500K inventories, 250K cash, 150K marketable securities and 100K accounts receivable) and 650K in current liabilities. If ABC Inc. current ratio is 1.54, what can be inferred from this?
Generally, a ratio equal or greater than 1.5 gives a first impression of company’s ability to operate near term without facing any liquidity problems. A ratio between 1.2 and 1.5 is still considered adequate for mature and declining stage businesses, however, could be alarming for startups and growth stage companies. The red flag should be raised if the current ratio is below 1 and 1.2 for premature and mature businesses, respectively.
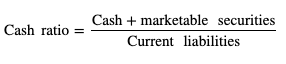
In manufacturing and retail industries, the companies tend to have a large portion of inventories on the balance sheet, which in most cases cannot be quickly liquidated into cash to cover the debt obligations. Thereof, the alternative is to use the cash ratio, which takes into account only cash ready for use. Again, assuming ABC Inc. had 250K cash, 150K marketable securities and 650K current liabilities as per year-end, the calculated cash ratio is 0.62.
Generally, a ratio of less than 0.5 is deemed to raise a red flag. To draw any conclusions from a cash ratio between 0.5 and 1 (as in this case 0.62), an investor shall dig further into company’s quickly convertible current assets and add them in the numerator.
Sales efficiency
Third, another important metric in company evaluation is the ability and frequency to generate sales by utilizing its assets. For companies that manufacture, produce, resell goods or mainly generate sales by selling inventory, the most commonly used are the asset and inventory turnover ratios.
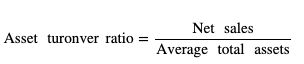
Asset turnover ratio essentially can tell the investor how well the company generates sales from its average assets in a 2 year period. Let’s continue with our example of ABC Inc., where they reported 3.5M and 2.8M in total assets for this and the previous reporting period. Assuming this year the company generated 10M in net sales, the asset turnover ratio is 3.17. What does it mean in analysis?
As businesses from different industries provide totally distinctive outcomes, the asset turnover ratio does not tell much about the target company on its own. It shall be compared with a peer or direct competitor in the same industry, in order to draw any conclusions. Without a surprise, the higher the asset turnover ratio, the more efficiently company uses its assets to generate revenue. A red flag would be confirmed if the ratio is significantly lower compared to peer companies.
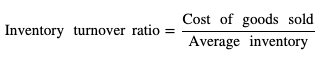
Inventory turnover ratio, as the name suggests, is appropriate to use for companies that actively trade inventory. In the example, ABC Inc. had 500K and 450K inventory at the end of this and previous year, respectively. Let’s assume cost of goods sold equaled 6M to generate 10M in revenue, hence, the inventory turnover ratio is 12.63. Again, as mentioned earlier, this ratio does not indicate much by itself. Therefore, it is strongly recommended to not only evaluate your target company but preferably 2 or 3 peer companies. It might help you to understand the target company’s market position against closest rivals and business sustainability going forward. If the target company’s ratio is lowest among its closest competitors, a red flag should be raised.
What if the company has zero inventory?
In this case, the universal efficiency ratio comes in handy. To find the result, you will only need to use the net revenue and non-interest expenses, which in simple terms looks like this:
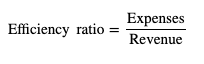
The efficiency ratio is widely used when evaluating financial institutions, such as banks, fintech, etc., which have zero or an insignificantly small amount of inventory. Although the smaller the ratio, the better is true in all situations, the best approach is to compare the efficiency among the last 2-5 periods. Let’s adopt an example of another company Bnk Inc. that provides banking services. This year it reported 44M and 21M in total revenue and non-interest expenses, respectively. Last year the numbers were 51M and 26M. Thereof, the calculated efficiency ratio for this year and year before is 47.7% and 50.9%, respectively. Usually, the optimal benchmark is 50% or lower, whereas an increasing efficiency ratio suggests that expenses are increasing more than revenue, as in this case. Typically, if the efficiency ratio is increasing on a yearly basis for at least 3 periods, it shall be recognized as a red sign due to deteriorating sales-generating efficiency.
Business profitability
Last, let’s review several ratios that might help to understand whether the target company can sustain profitability going forward. The most extensively used measures are gross (and net) profit margin, EBIT and EBITDA margin, and return on equity ratio.
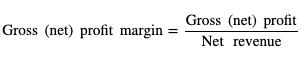
One of the easiest and widely used is the gross profit margin which offers the first impression of the target company’s financial health. Returning back to the previous example, ABC Inc. closed the reporting period with 10M in net revenue and 6M in cost of goods sold. Therefore, calculating the difference (revenue-cost of goods sold) and dividing it once more by net revenue gives a gross margin of 0.4 or 40%. Suppose ABC Inc. generated 600K in net profit, resulting in a net profit margin of 0.06 or 6%. By default, higher percentage is always favorable. An incorrect approach would be to compare gross margins across different industries, such as comparing apples to oranges. Preferably, growth-stage companies present a gross profit margin of at least 50%. The rationale behind is that premature businesses shall spend a greater portion on marketing and R&D, therefore, the lower the gross margin, the higher likelihood of experiencing losses. It can be very subjective and situation-specific to determine a threshold that would act as a red flag. On one hand, a net profit margin between 10-20% is considered optimal. On the other hand, anything below 10% indicates relatively weak profitability. Note to mention, the results can vary by industry and stage of business, hence, our recommendation is to perform an equal-industry relative company analysis. The general assumption is to become more profitable year-over-year, therefore, a red sign would appear for companies that indicate a lower net profit ratio for at least 2 consecutive periods.
Similar to gross (net) profit margin, sometimes it is useful to compute EBIT and/or EBITDA margin additionally. Earnings before interest, taxes, depreciation and amortization (EBITDA) measures the company’s operating performance, by adding the interest, tax, depreciation and amortization expense back to the net profit.
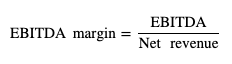
Let’s recall that ABC Inc. had generated 10M in revenue and 2.3M in EBITDA, which gives an EBITDA margin of 0.23 or 23%. As it is extremely difficult to determine a threshold for optimal margin, analysts usually perform relative company performance comparison. In theory, EBITDA margin greater than 10% is one of the indicators that suggest the target company is more likely in a financial healthy position. Anything below 10% does not necessarily point to a red flag, but should be investigated further. In practice, you would need to calculate all 4 margins touched upon so far to derive anything meaningful. For example, a suitable EBIT margin for manufacturing companies would be around 30%, whereas many retailer businesses operate with a tighter, less than 10% profitability. In practice, a red flag should be raised if the following two conditions are met: EBIT or EBITDA margin of the target company is considerably lower compared to its peers and it has been descending for at least 2 consecutive periods.
Investors are often curious to know their return on investment. If you are willing to invest directly in a company and become a shareholder, computing return on equity (ROE) can help to understand whether the investment suits your preferences.
So far, we know that ABC Inc. generated 600K in profits in the last reporting period, and, presented 1.5M in total shareholder’s equity. The calculated return on equity is 40%, which is considered very high. In reality, most companies publish ROE in the 10%-20% range. While ROE between 5-10% should raise some caution and require further investigation, everything below is observed as a red flag, especially if the ratio is negative.
Further investigation should be focused on the revenue and cost sources, comparison on the above mentioned financial ratios with previous years and couple of competitors operating in the same industry. Helpful is to understand whether the targeted business is expanding, i.e. spending money on R&D, new product development, that might worsen financial performance now, but bear juicier fruits (profits) later on. If there is no such evidence, perhaps there are some news concerning the business, regarding suppliers, customer satisfaction, maybe some problems with production or economic situation in the base country. In most cases, a worsening operating efficiency and financial performance is temporary, due to some internal or external factor. Thereof, be aware that a more in-depth company research will better help to understand the factors influencing the target company’s business and make a better informed decision.